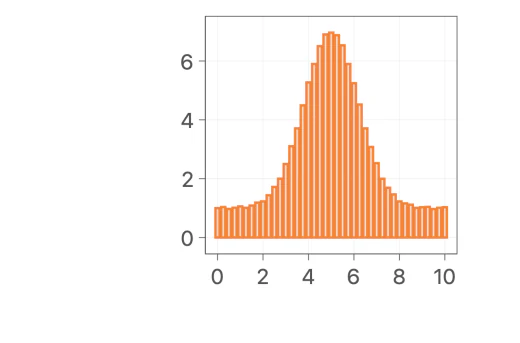
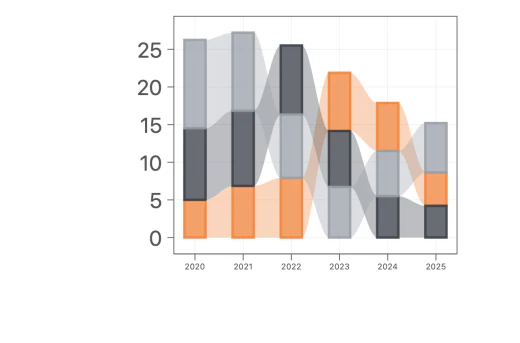
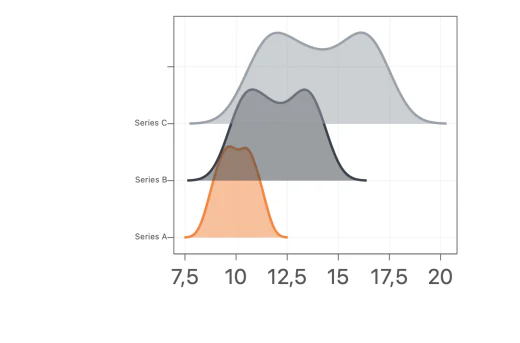
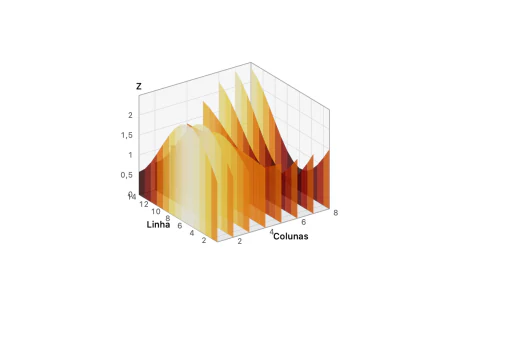
R² 0.9974
Curve fitting
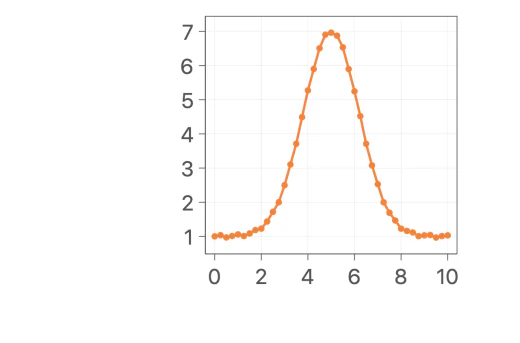
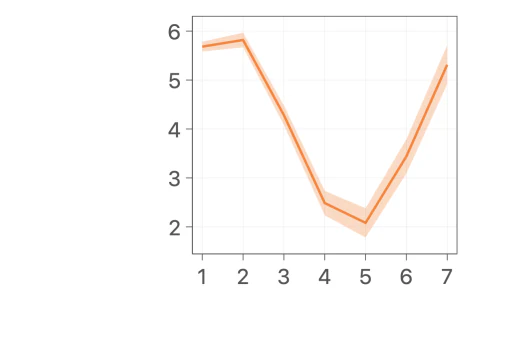
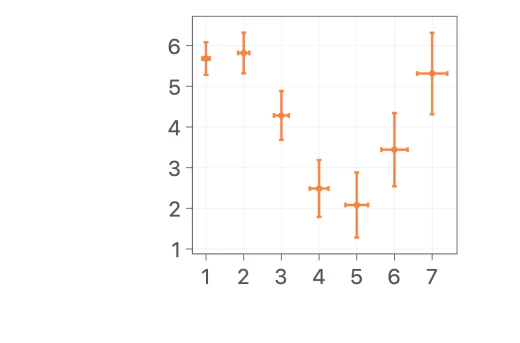
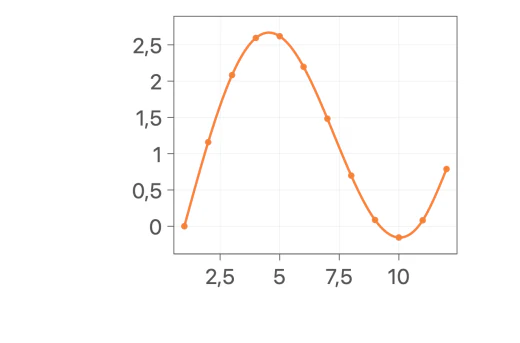
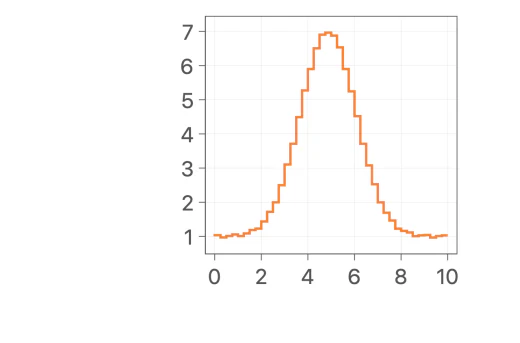
Adsorption kinetics, pseudo-first order: qe = 48.8 ± 0.8 mg/g. More than 200 ready-made models, or your own equation.
Plotar · for Mac
From instrument data to the figure in your paper, in minutes. Do it yourself or just ask the Assistant.
Without AI too
The screenshots and the video were made with the app in Portuguese. On a Mac set to English, Plotar runs in English.
Data analysis
Band deconvolution
Raman spectrum of carbon. The baseline is removed first; the D, D3 and G bands are fitted together.
| Band | Center (cm⁻¹) | FWHM | Area |
|---|---|---|---|
| D | 1350.0 ± 0.04 | 60.3 | 48.7% |
| D3 | 1500.0 ± 0.2 | 90.9 | 22.2% |
| G | 1590.0 ± 0.05 | 45.2 | 29.1% |
R² 0.9991sum of the bands against the data
R² 0.9974
Adsorption kinetics, pseudo-first order: qe = 48.8 ± 0.8 mg/g. More than 200 ready-made models, or your own equation.
5 peaks, 2 phases
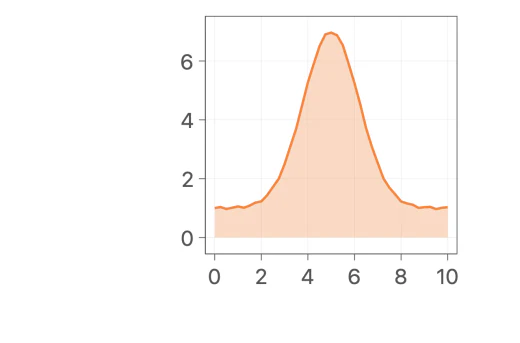
Anatase and rutile marked at the positions you provide. The baseline is corrected before labeling.
Savitzky–Golay
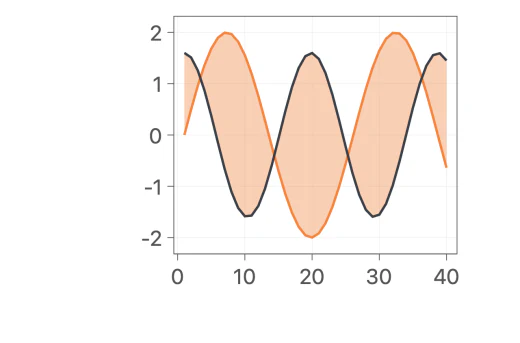
A 15-point window over a noisy spectrum. The result goes onto the graph in one click.
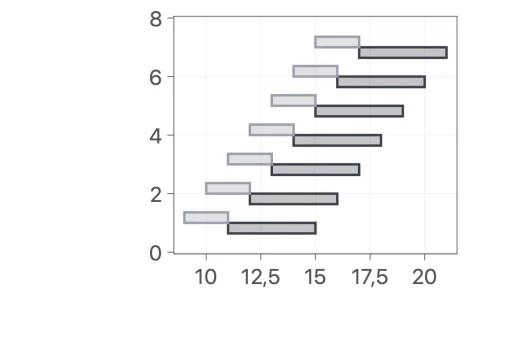
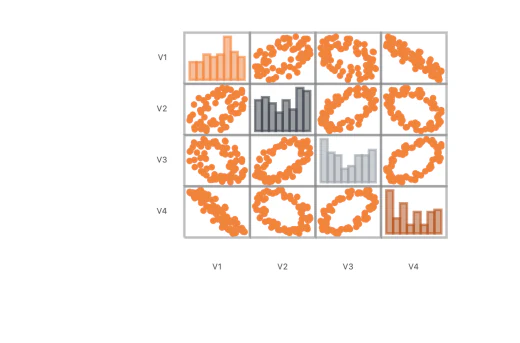
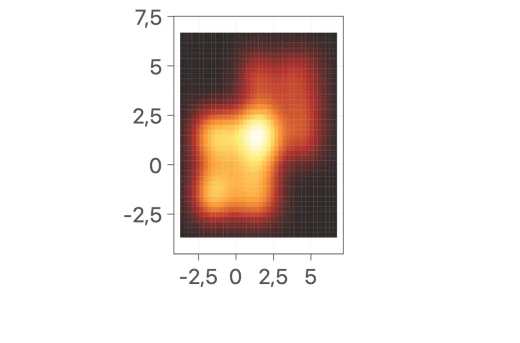
Sample data; calculations and graphs made by Plotar (axis numbers use the decimal comma). Also: linear and polynomial regression, model comparison, descriptive statistics, FFT and batch processing, where several files with the same columns each become a graph.
Gallery
Pricing
US$ 59.99
one-time purchase on the Mac App Store
US$ 9.99
per month, in-app subscription
US$ 14.99
per month, in-app subscription
Prices in US dollars. In other countries the App Store shows the equivalent in the local currency.
Frequently asked questions
No. Importing, plotting, fitting, analyzing and exporting all work offline. Only the Assistant needs a connection, and only at the moment you send a request.
Yes. The purchase unlocks the whole app, with no time limit, and includes 100 credits to try the Assistant. The subscription is only needed to keep using the Assistant after those credits.
Macs with Apple silicon (M1 or newer) and macOS 14 Sonoma or later.
Yes. Plotar opens OPJU projects with their worksheets and graphs, so you can pick up where you left off. Very project-specific features may need some fine-tuning after opening.
The text of the request, a summary of the open project, the worksheet values it looks up and the files you attach. The request goes through the Plotar AI service, which checks the purchase, and is answered by Anthropic's Claude model. The Plotar server does not store the text of requests, the answers or your data. Details in the privacy policy.
In your Apple account settings, at least 24 hours before renewal. The app remains yours; only the Assistant stops receiving new credits.
English, Brazilian Portuguese, Italian, French, German and Spanish. The interface follows the language set on your Mac.
Yes. The Help menu opens a 41-page visual manual, currently in Portuguese, with screenshots of the app, numbered steps and a map of the window in which each area leads to its explanation.
US$ 59.99, once. With 100 credits to get to know the Assistant.